Spots: Step 2 - Analyzing Plates
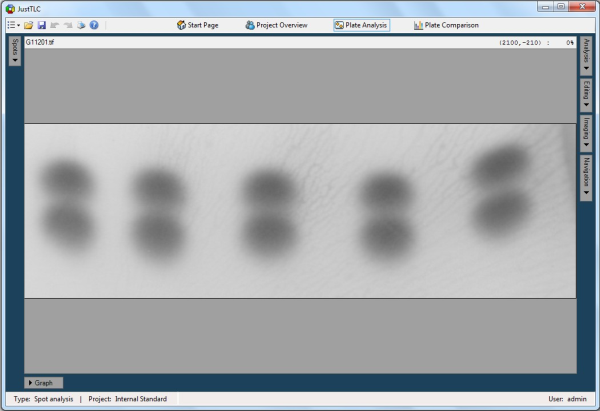
Plate analysis is done in the Plate Analysis ( ) control view. By double clicking in the plate "G11201.tif" you will
be redirect to the view, which is shown below. ) control view. By double clicking in the plate "G11201.tif" you will
be redirect to the view, which is shown below.
In the upper right part you will find the Analysis button. Click on it and
the Analysis panel is shown. Here, you find controls that are used when automatically
analyzing your plates. Use the Spot size slider and set the spot size to
5 of 10. This tells the detection and quantification algorithms how big spots we
are looking for.
Continue and change the number of spots to try to locate from 20 to 10. Click the
Detect button and the spots will be detected in the image. Detected spots
are marked as blue dots in the image. Expand the spot table by clicking on the Spots
button in the upper left part of the window. In the table the number of detected
spots is shown in the header and the spots properties such as ID, area and volume
area shown in the table.
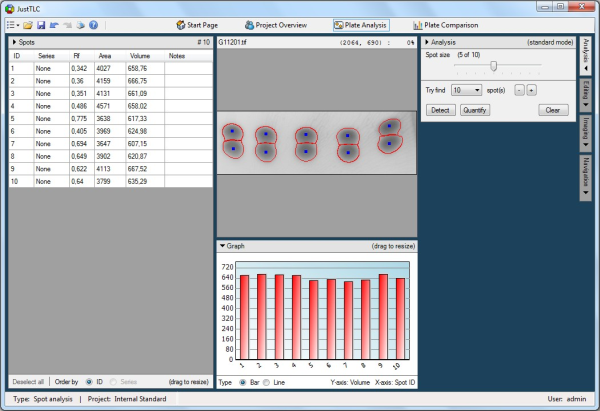
Finally, click on the Quantify button located in the Analysis panel.
Now, the blue dots will get a red contour around them and the spot volumes changes
from zero to something near 650 in the spot table. The result should look like the
screen shot above.
You have now analyzed your first TLC plate in the project.
Lane Analysis
Spot Analysis
|